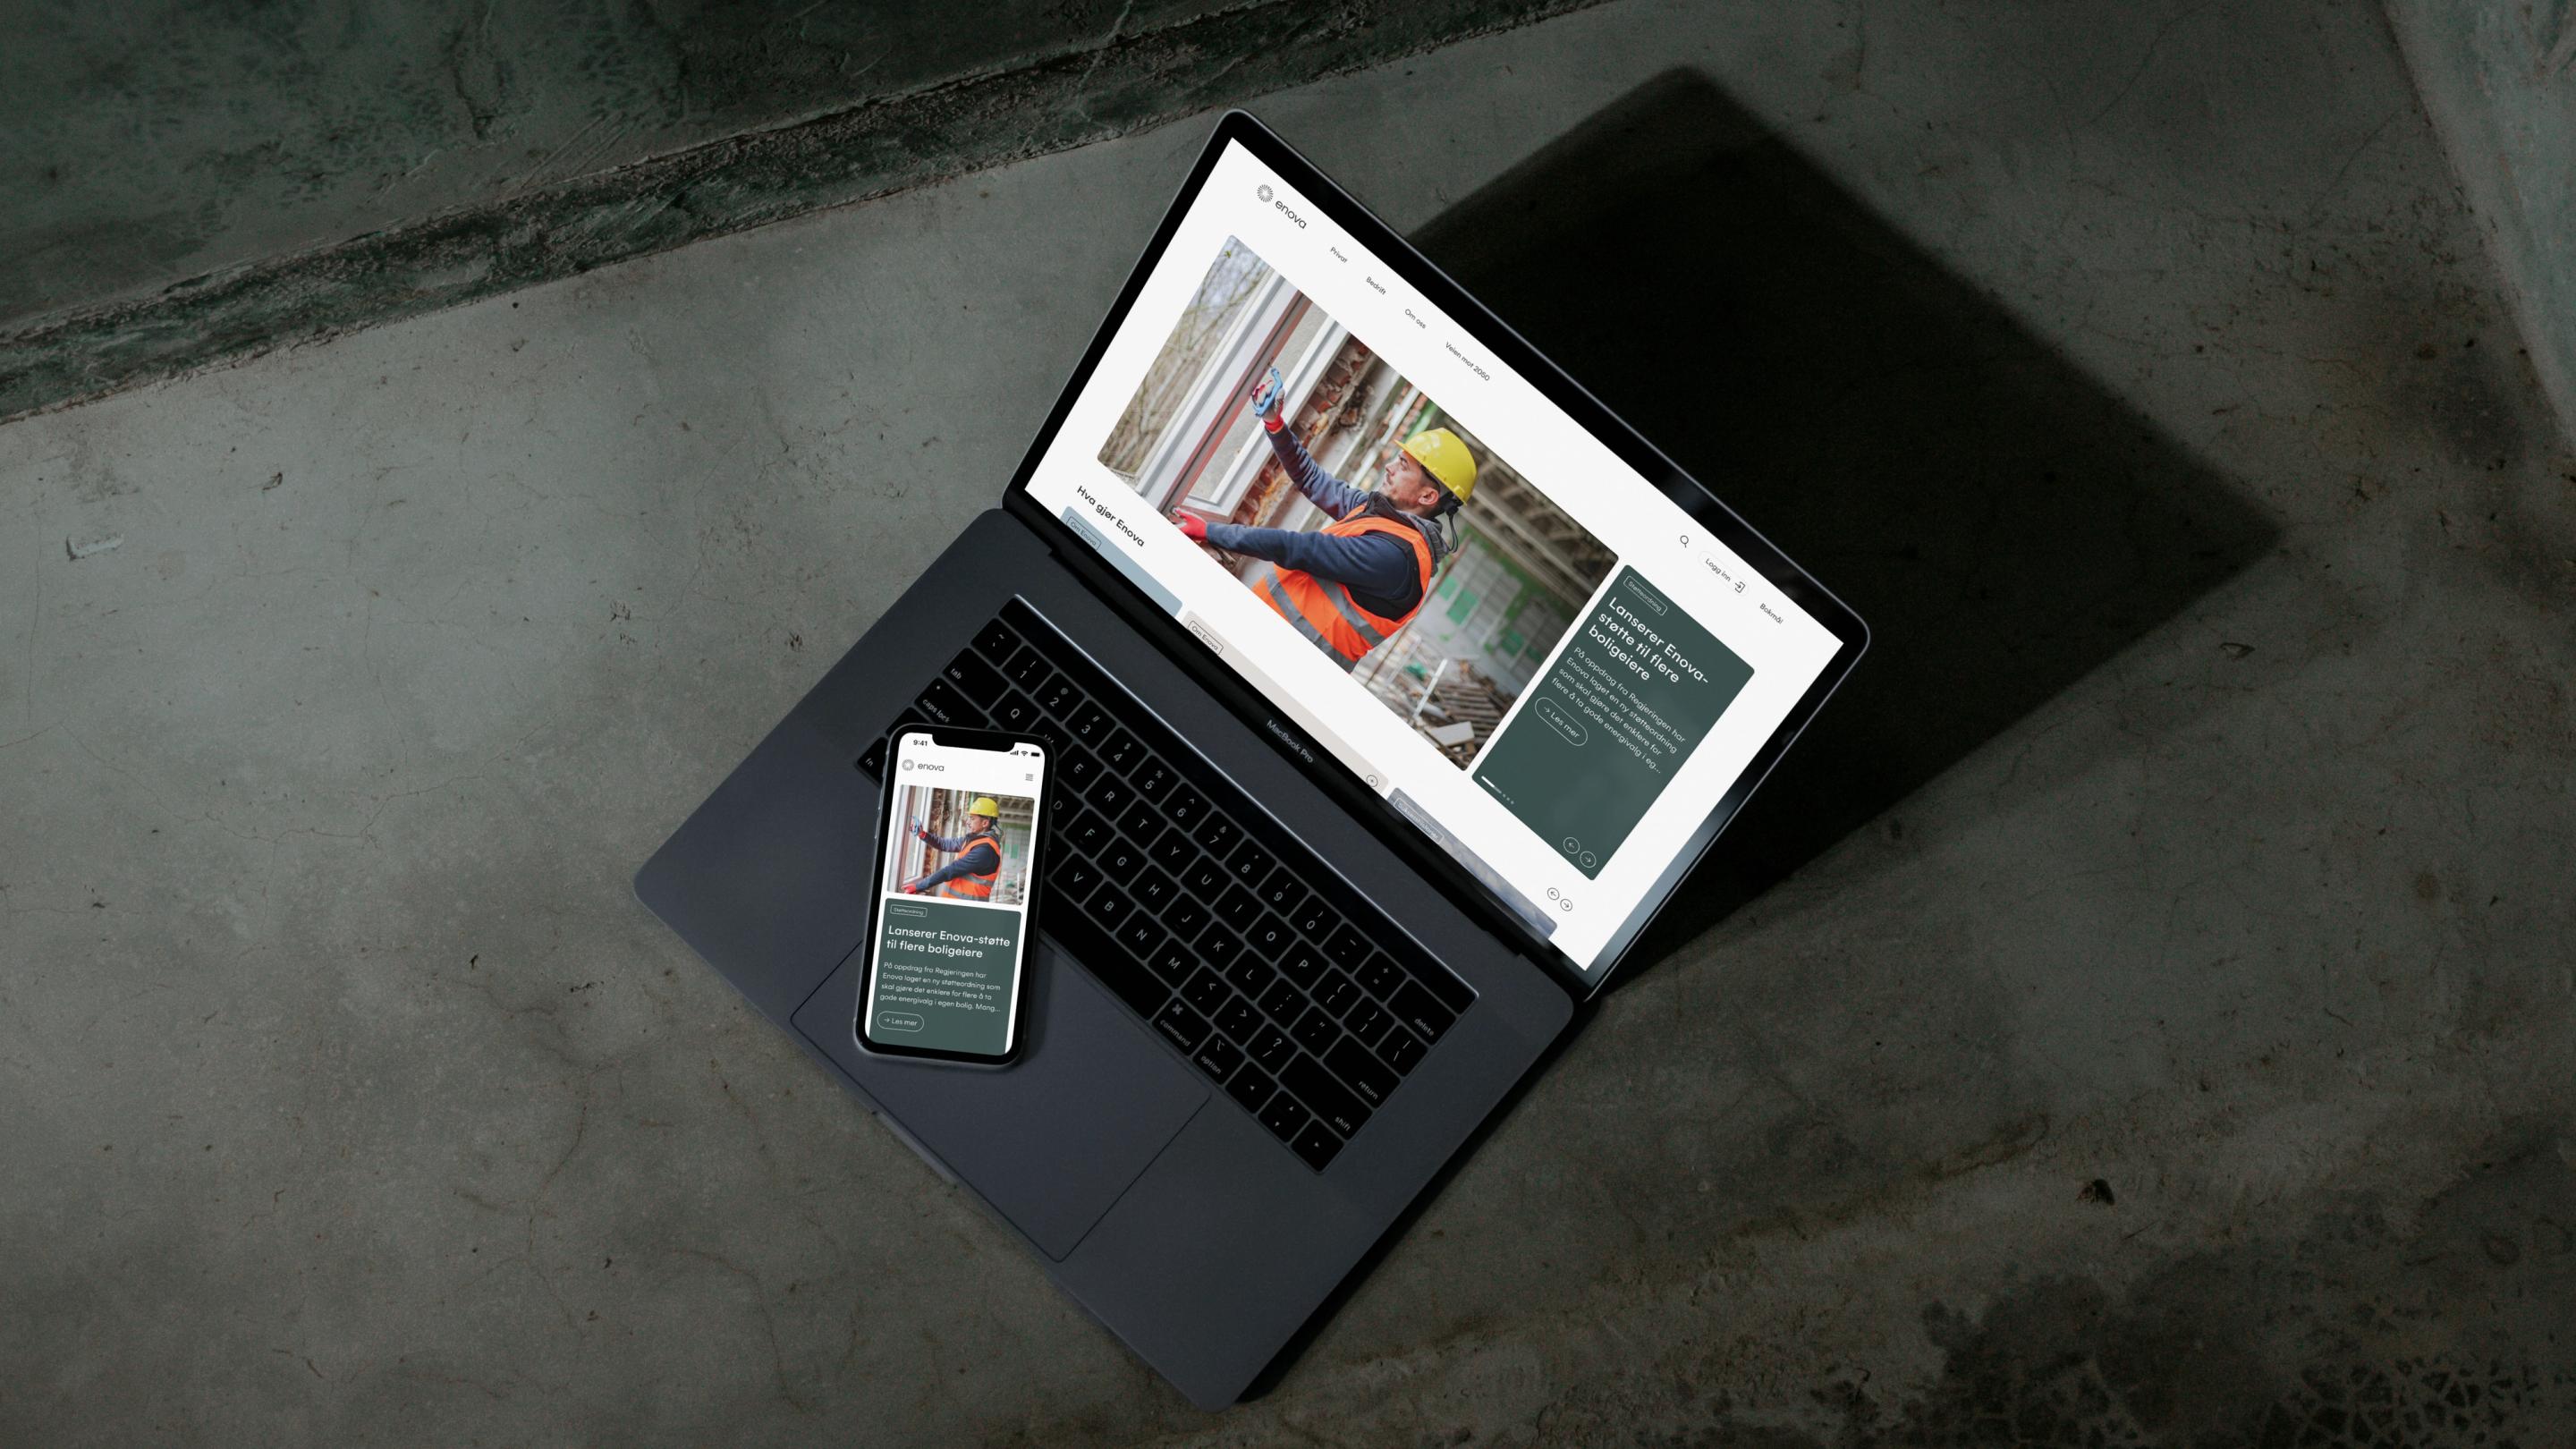
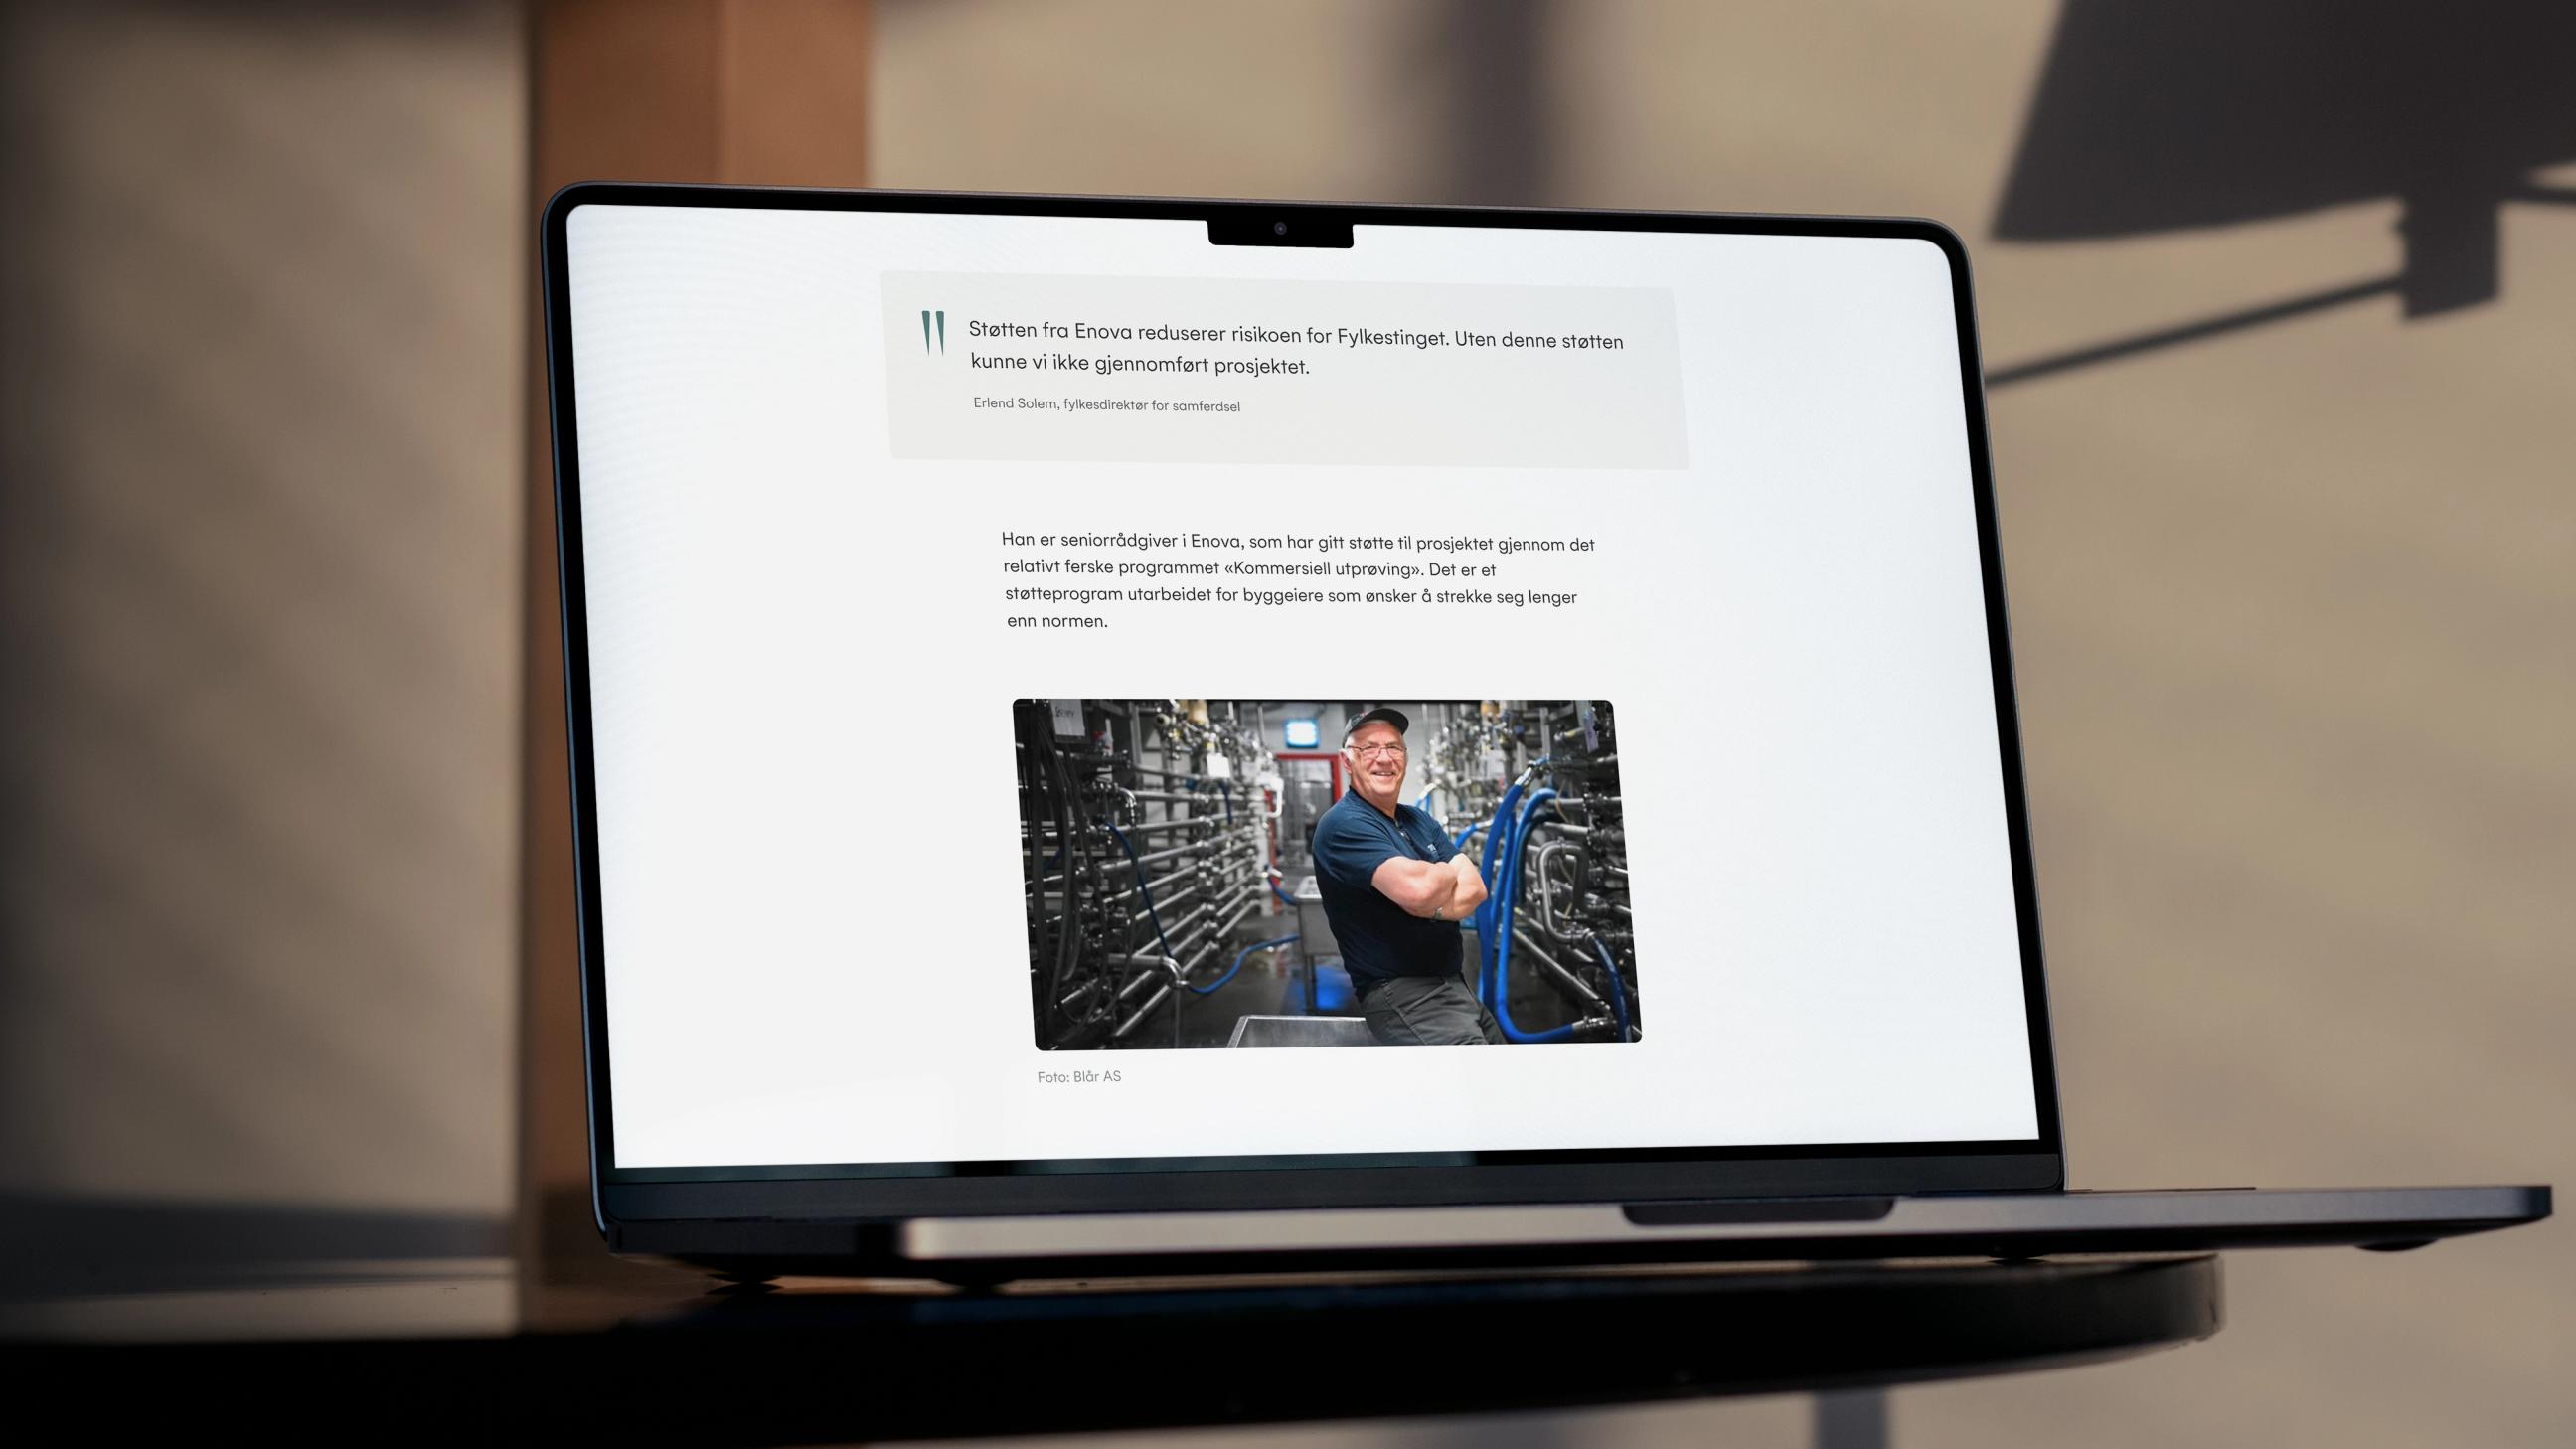
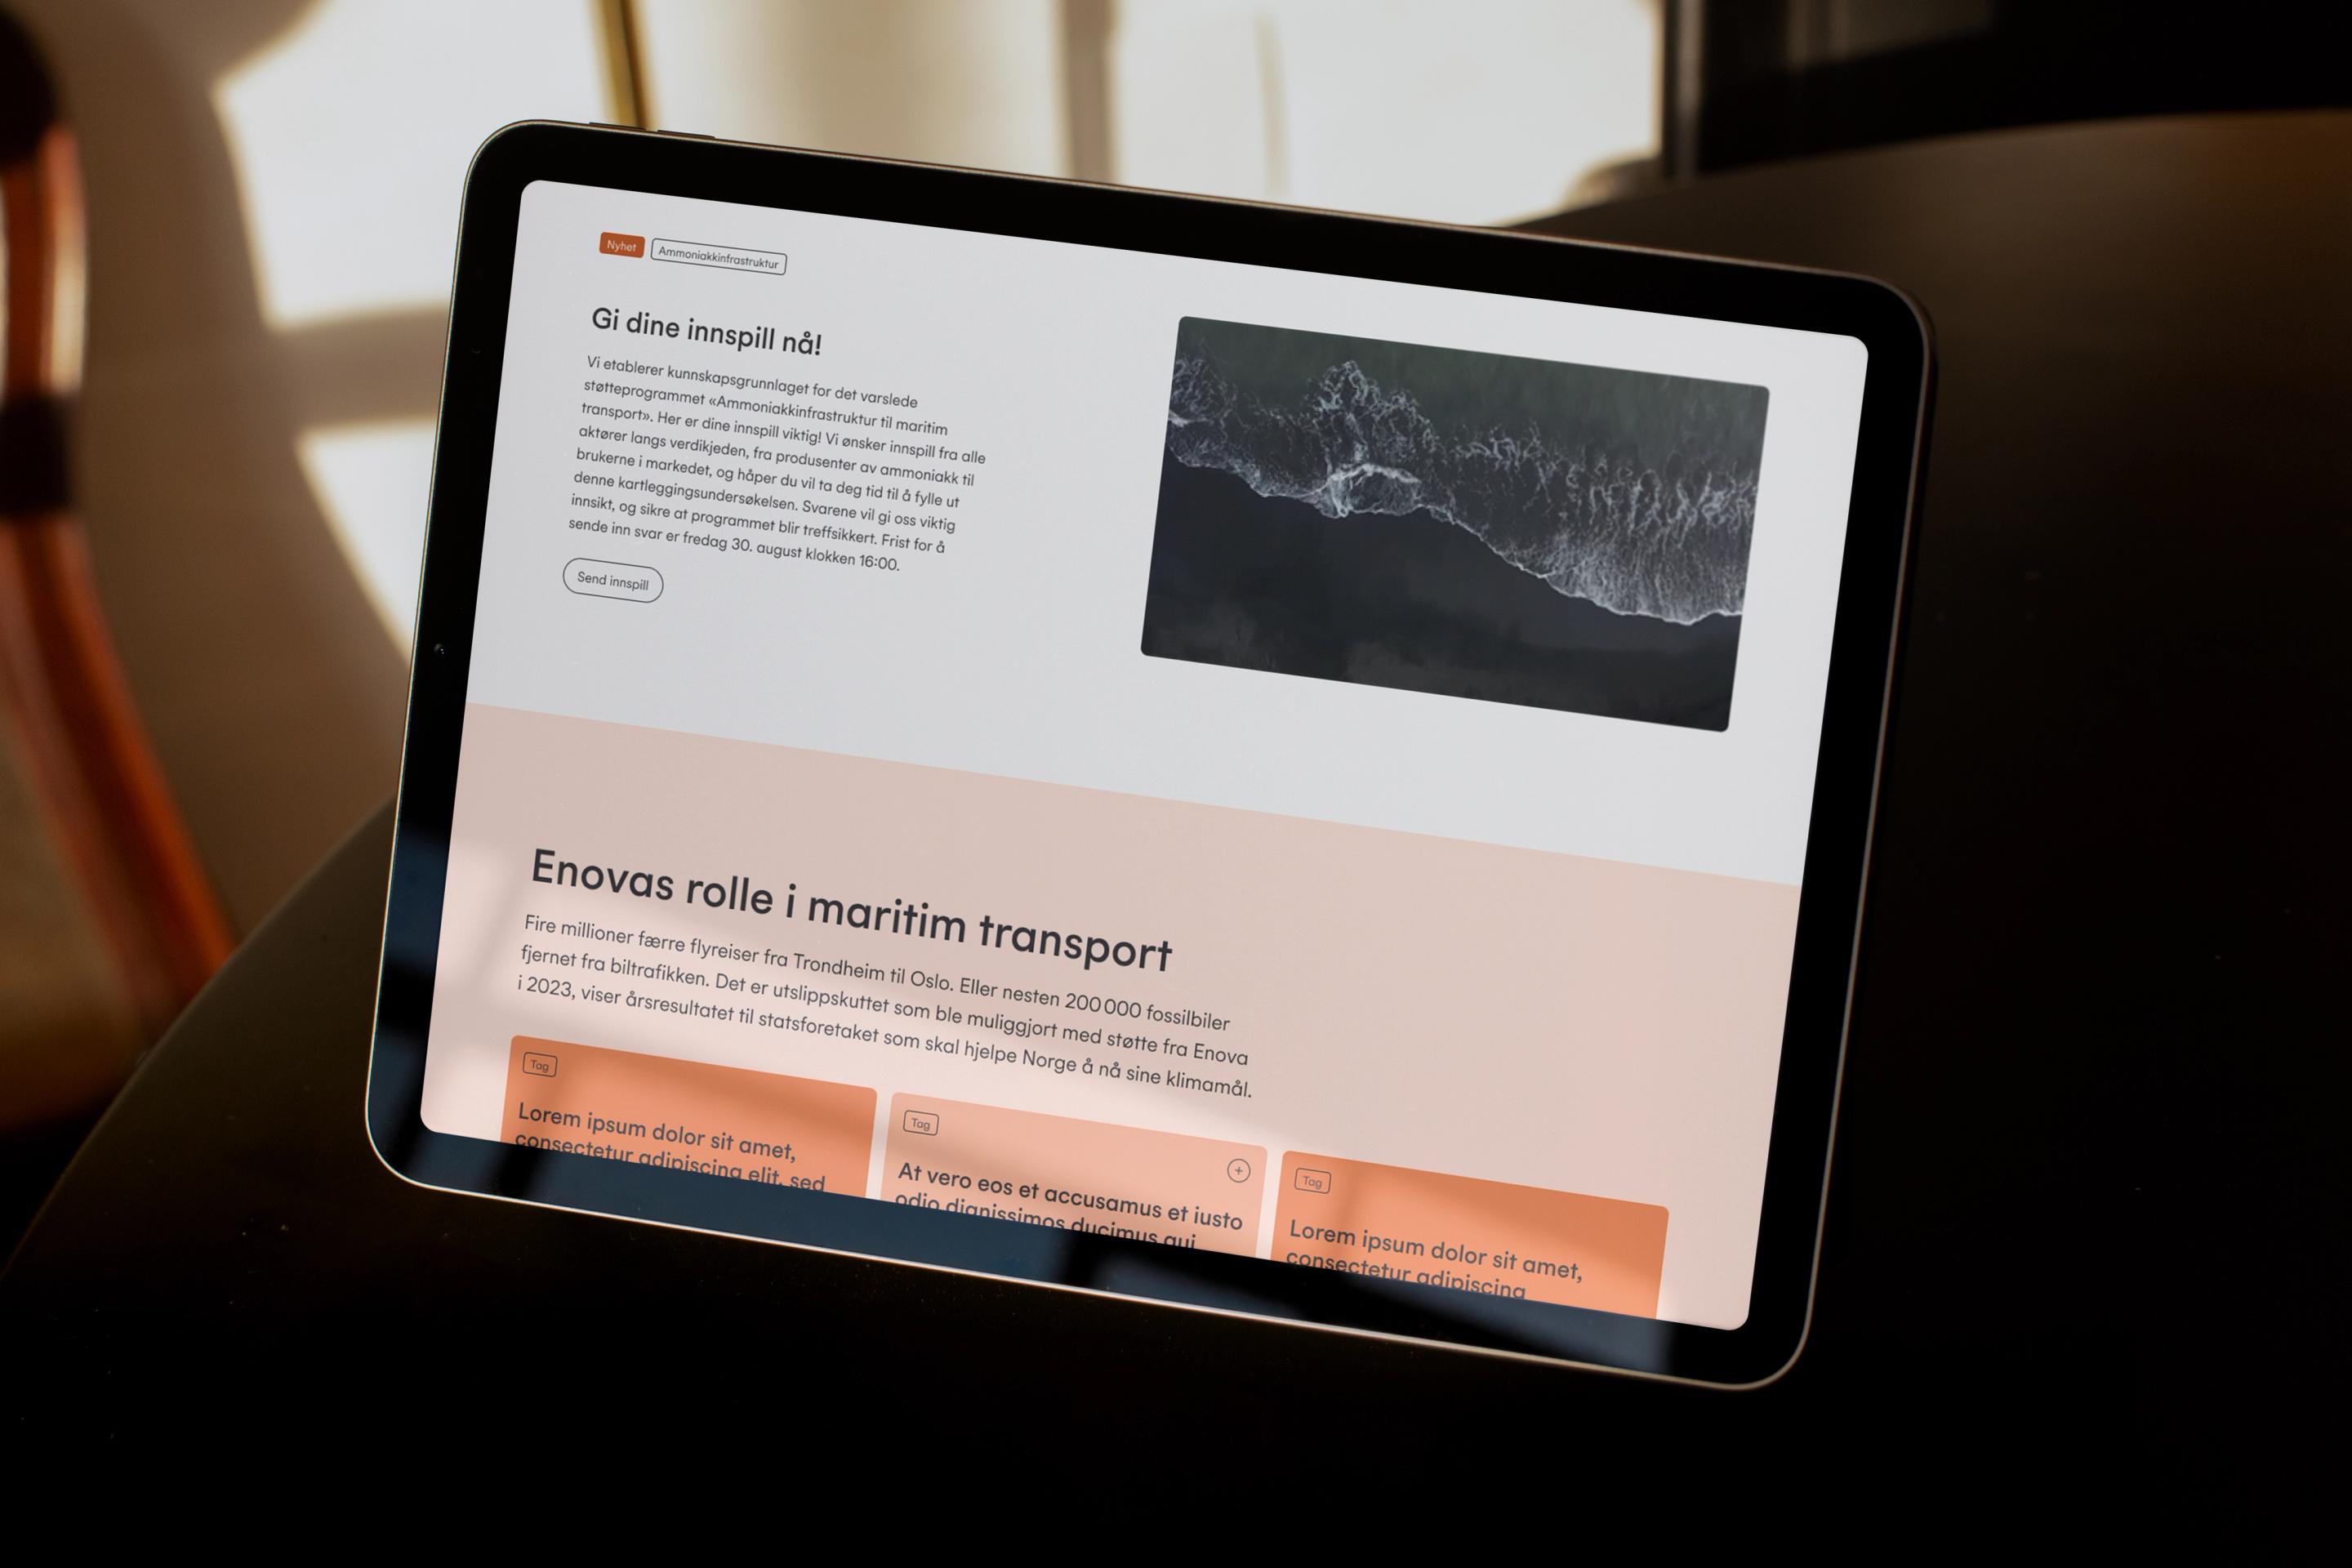
Redefining Enova.no with a clear, modular, and user-driven web experience.
About the project

Relevant cases
Brand
6

Yama
Nature, Movement, and Stability
Brand
10

Plateau
Steady, Effortless and Timeless
Brand
2
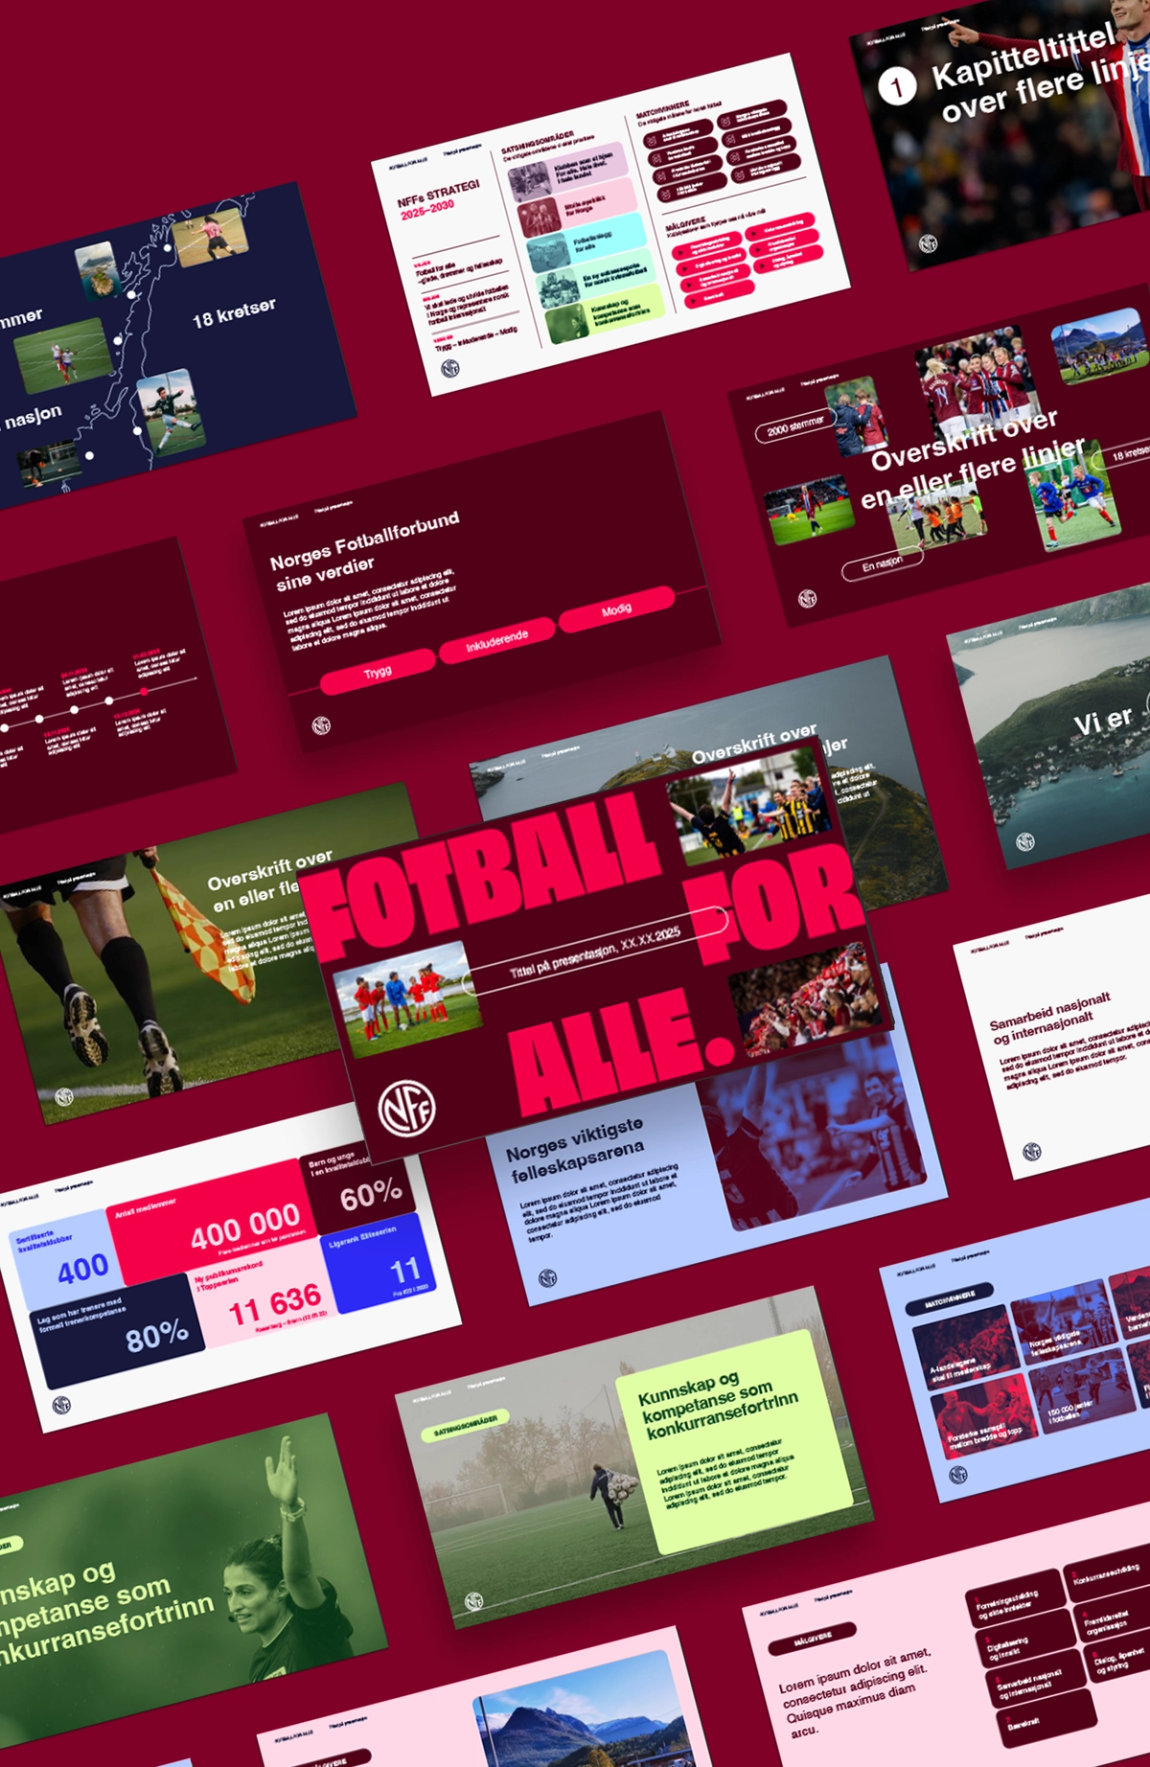
Norges Fotballforbund (NFF)
A Strategy for all of Norwegian Football
Technology
2
On request

Kavlifondet